Using Parameters in Dashboards
Dashboard Parameters allow a single Dashboard to display different data sets without requiring multiple copies of the same Dashboard. Instead of building individual Dashboards for different Parts, Processes, Locations, or date ranges, you can use Parameters to dynamically control what data is displayed.
In this guide, you will create a Dashboard that uses Parameters to filter data by Material and date.
Prerequisites
This guide assumes you have collected data across multiple dates and that your data records include multiple values of at least one Traceability field. For this guide, we will filter data using the Material Traceability.
If you do not have these prerequisites, first complete the following guides:
Create the Dashboard
To begin, create a new Dashboard. The fastest way to create a new Dashboard is to navigate to the Quick Chart menu entry, which acts as a shortcut for a new Dashboard.
Add a Retrieval
Next, add a Retrieval:
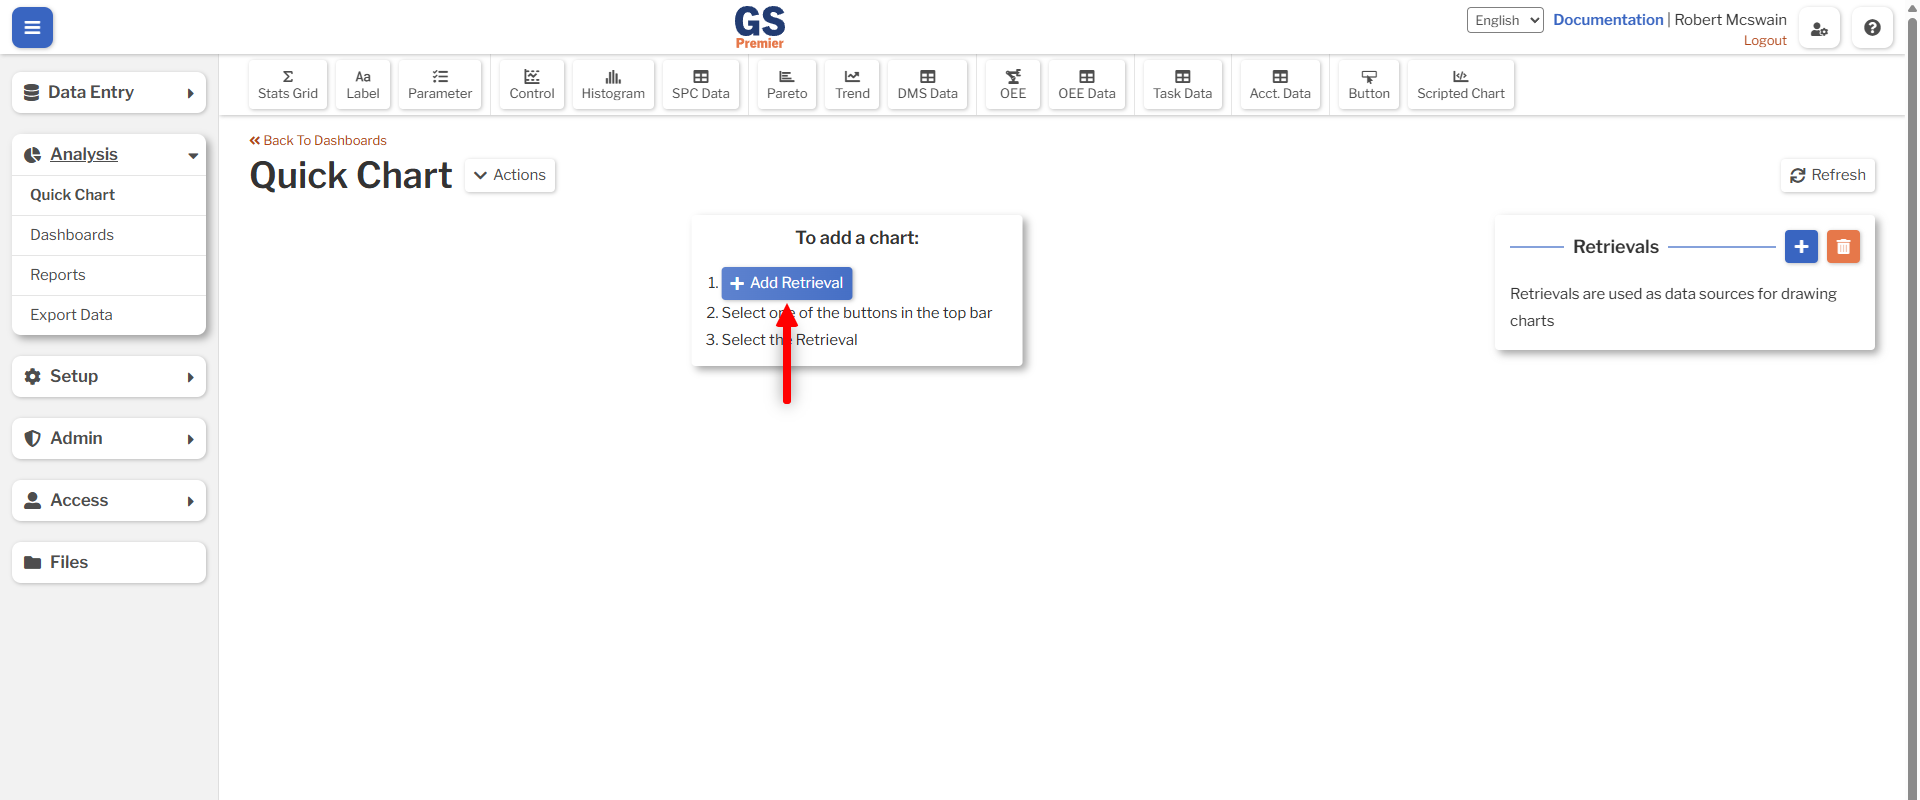
- Press the Add Retrieval button.
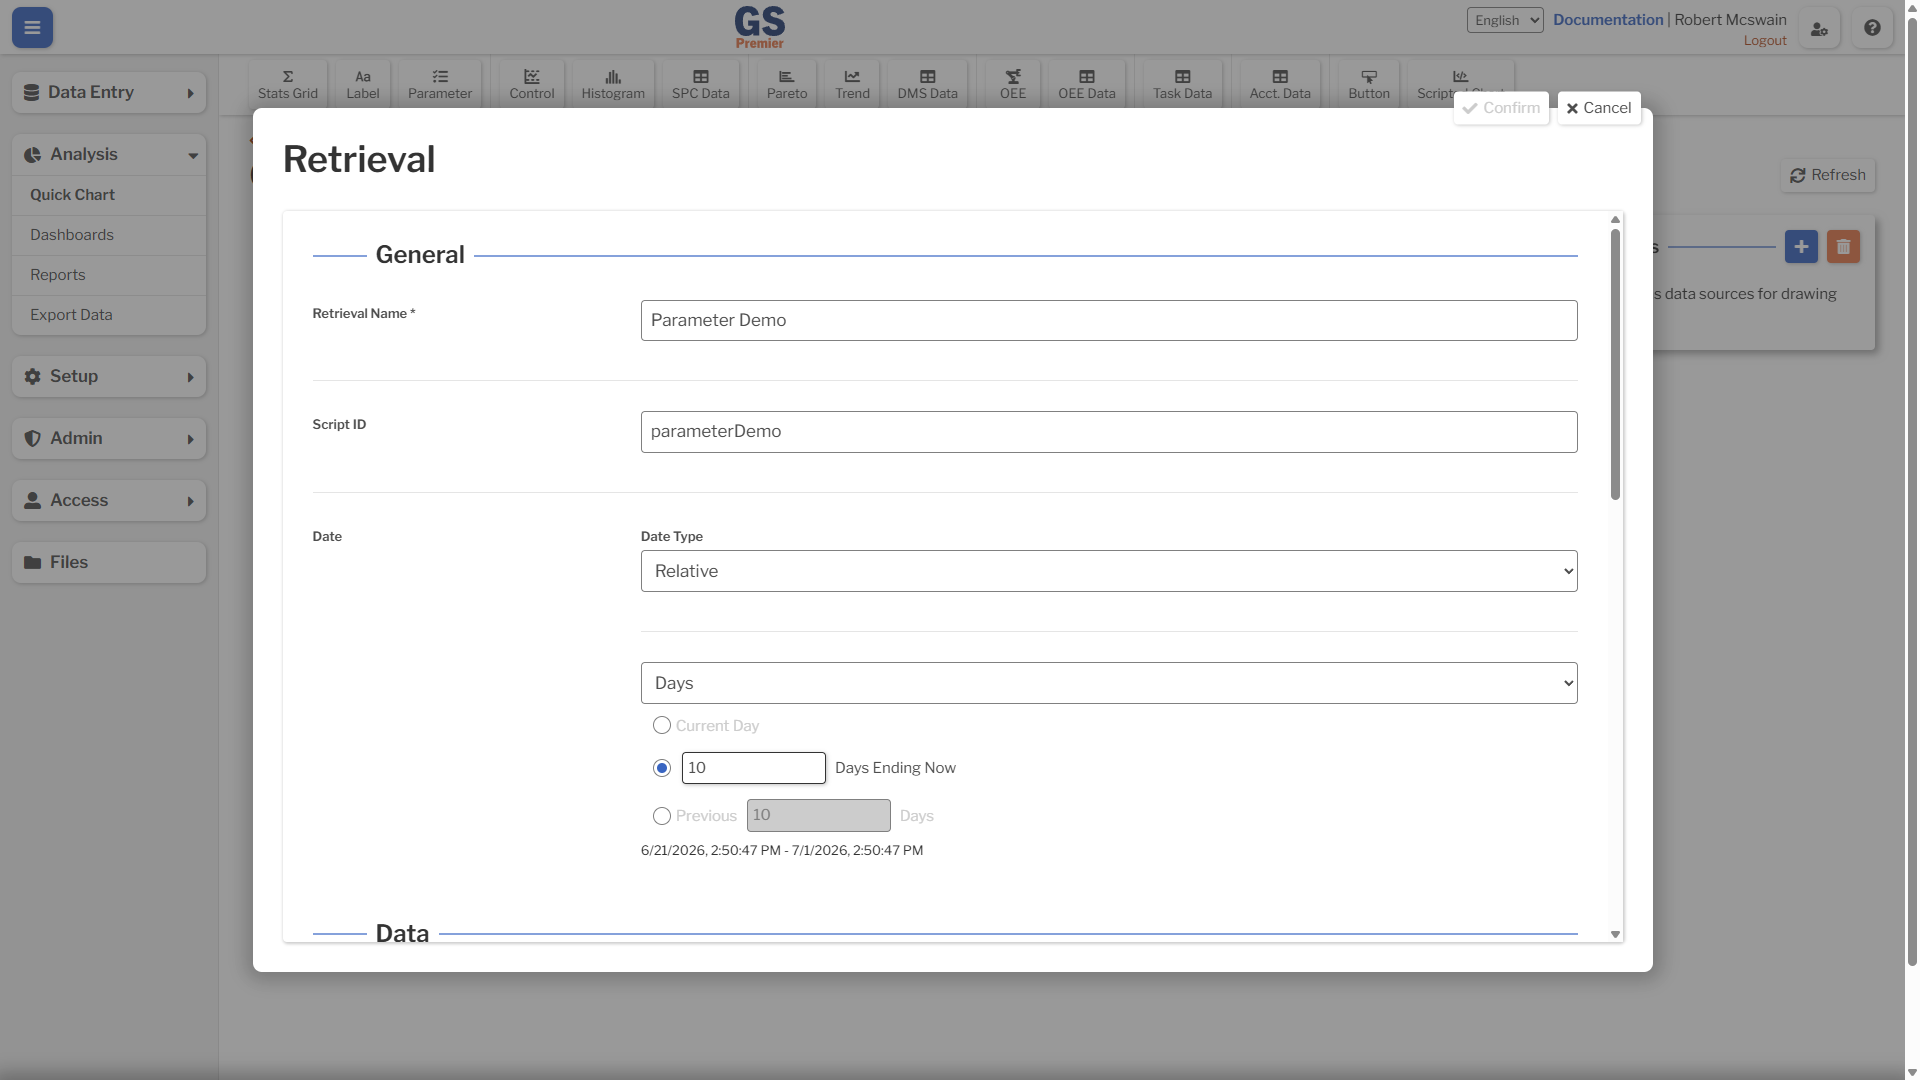
- Fill in the Retrieval Name with Parameter Demo.
- Modify the Date field to a range which includes data for your Process.
- Select your Process in the Processes field.
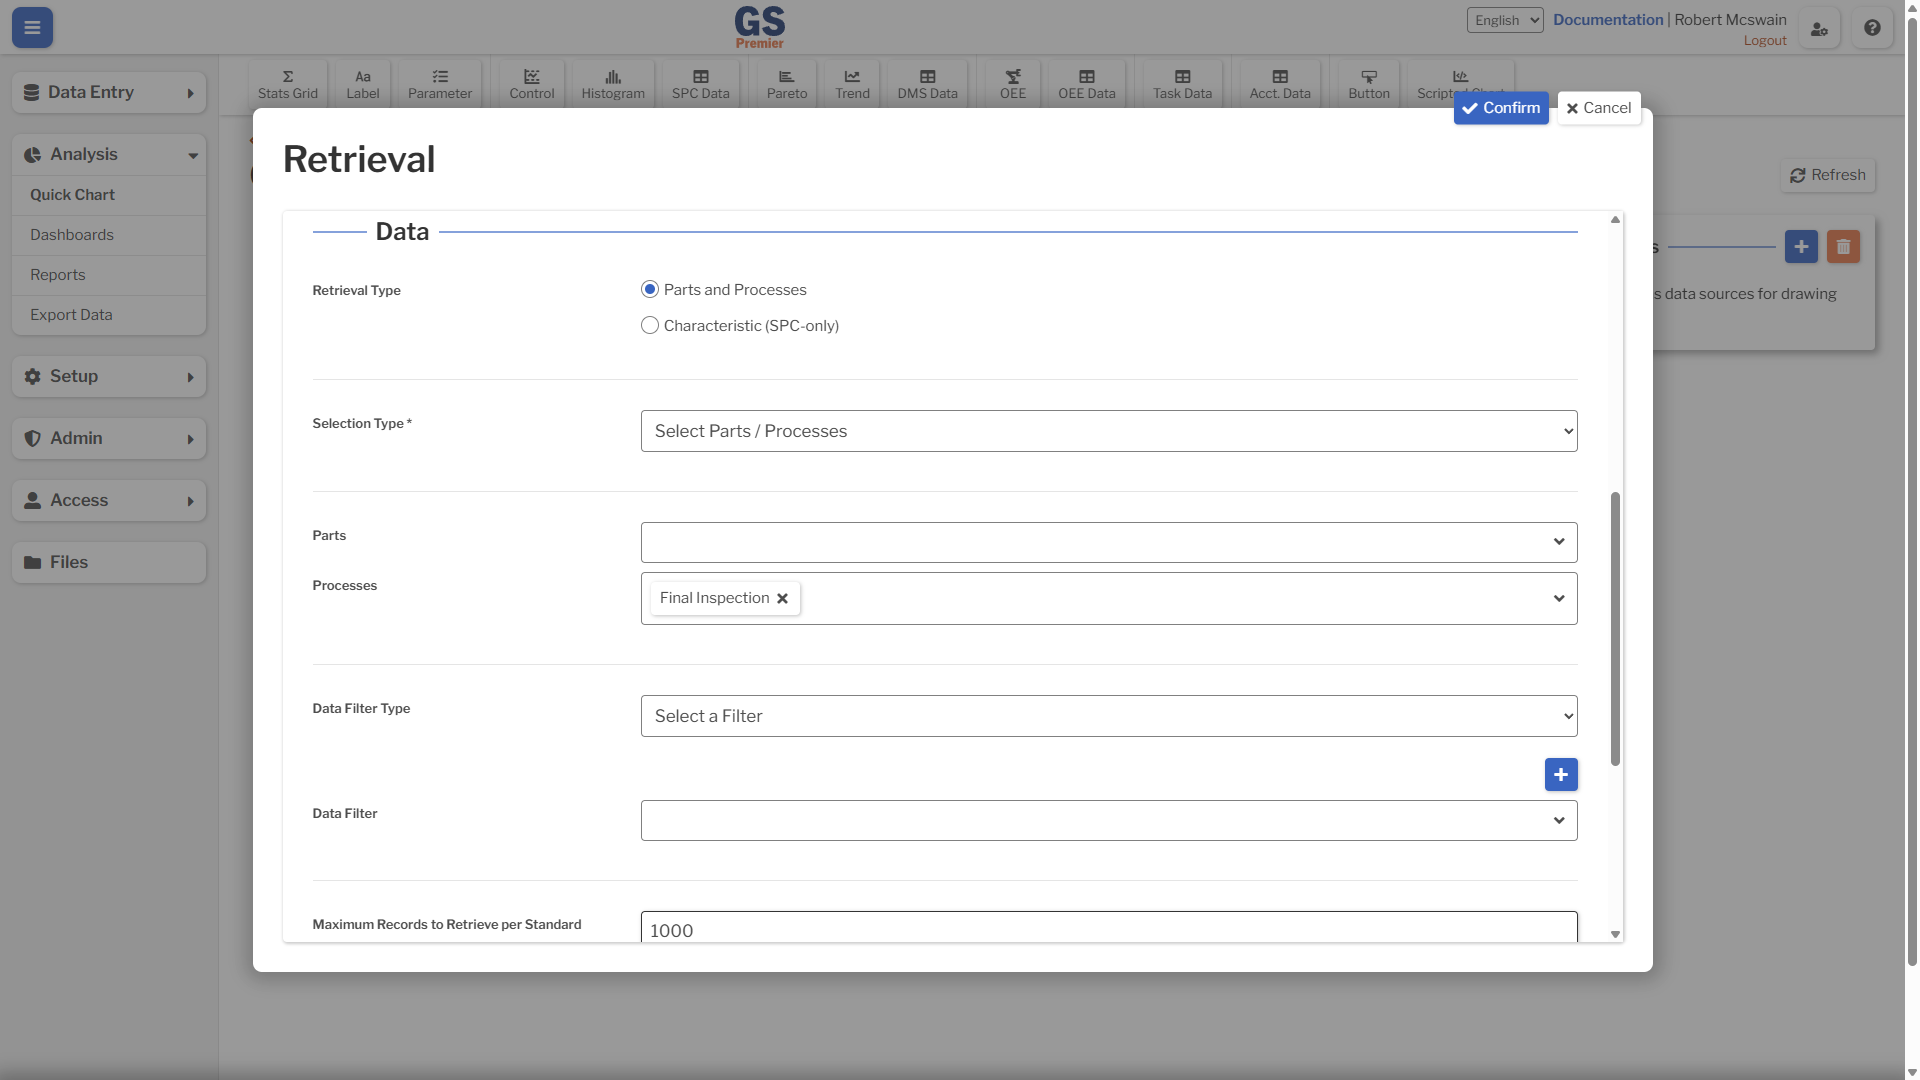
- (Optional) Update the Maximum Records to Retrieve per Standard to include more data.
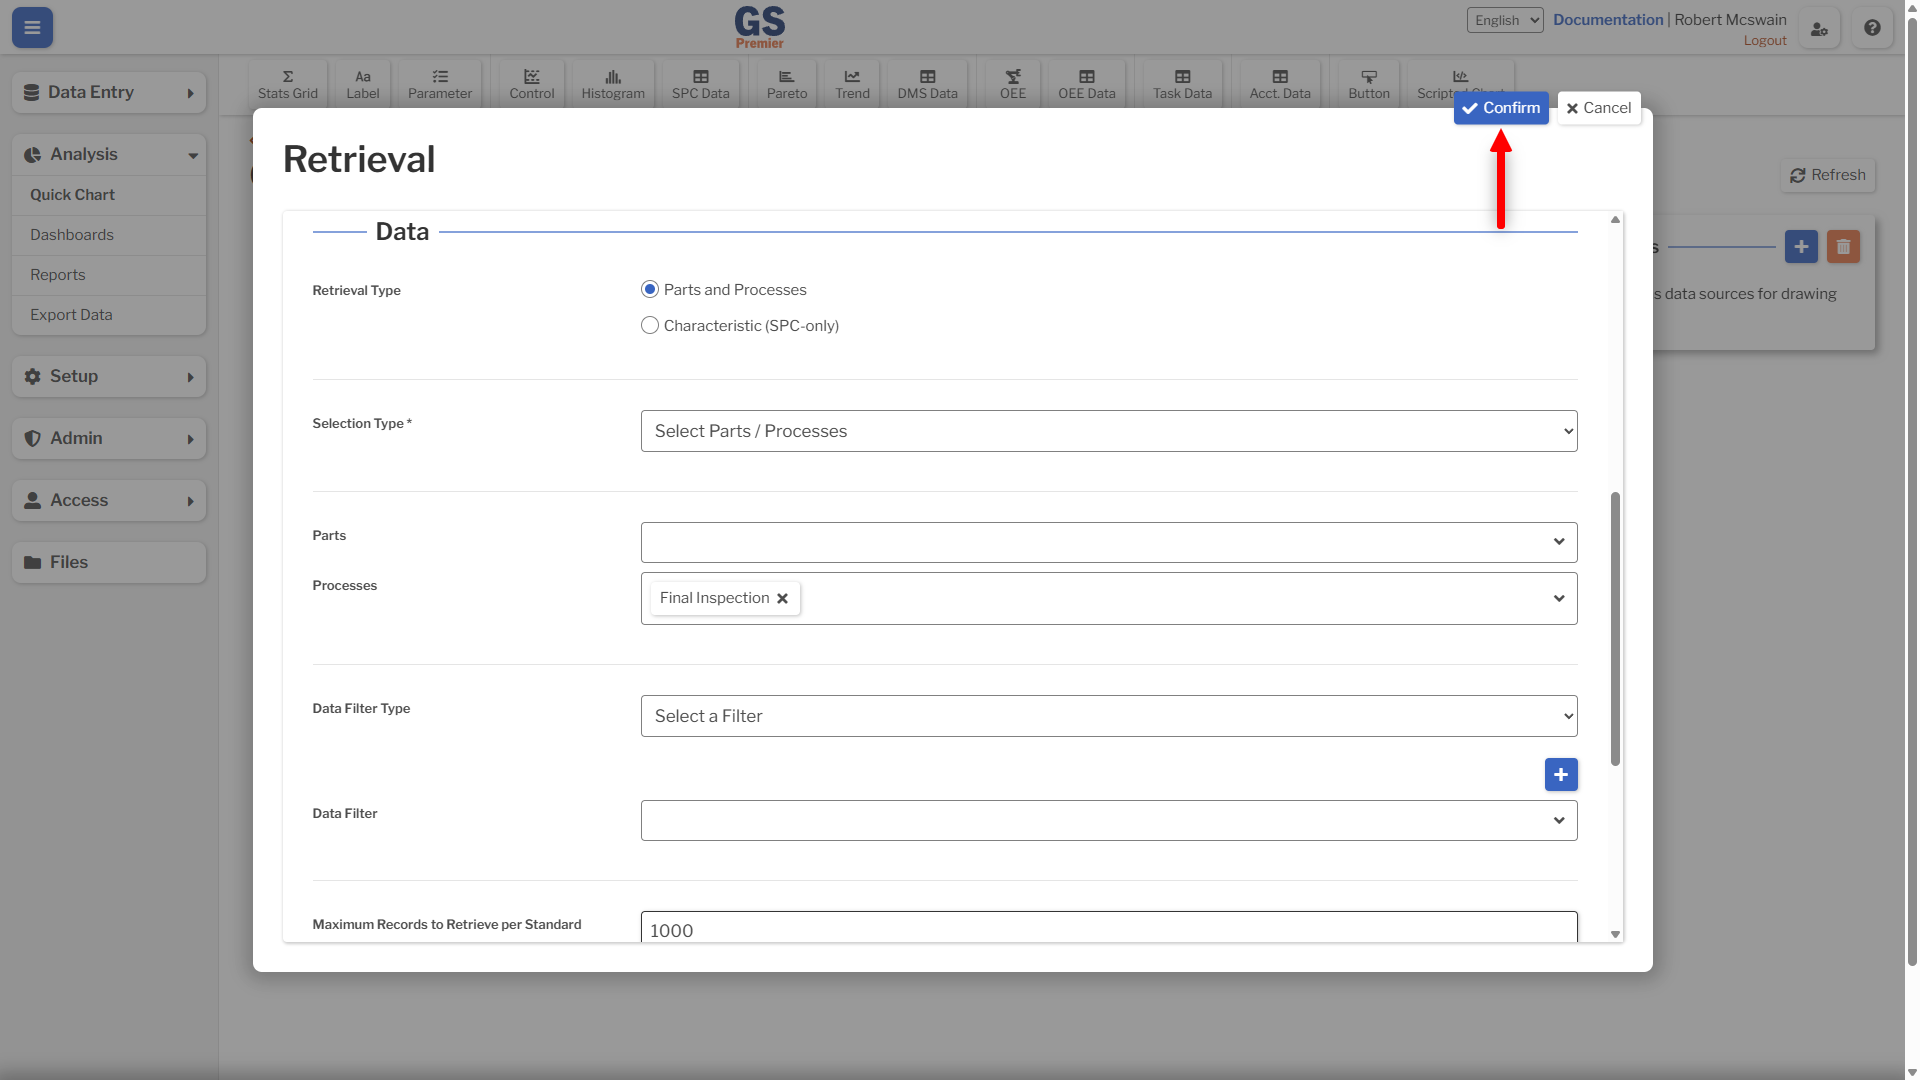
- Press Confirm.
Add Parameters
Add a Material Parameter:
- Select the Parameter button.
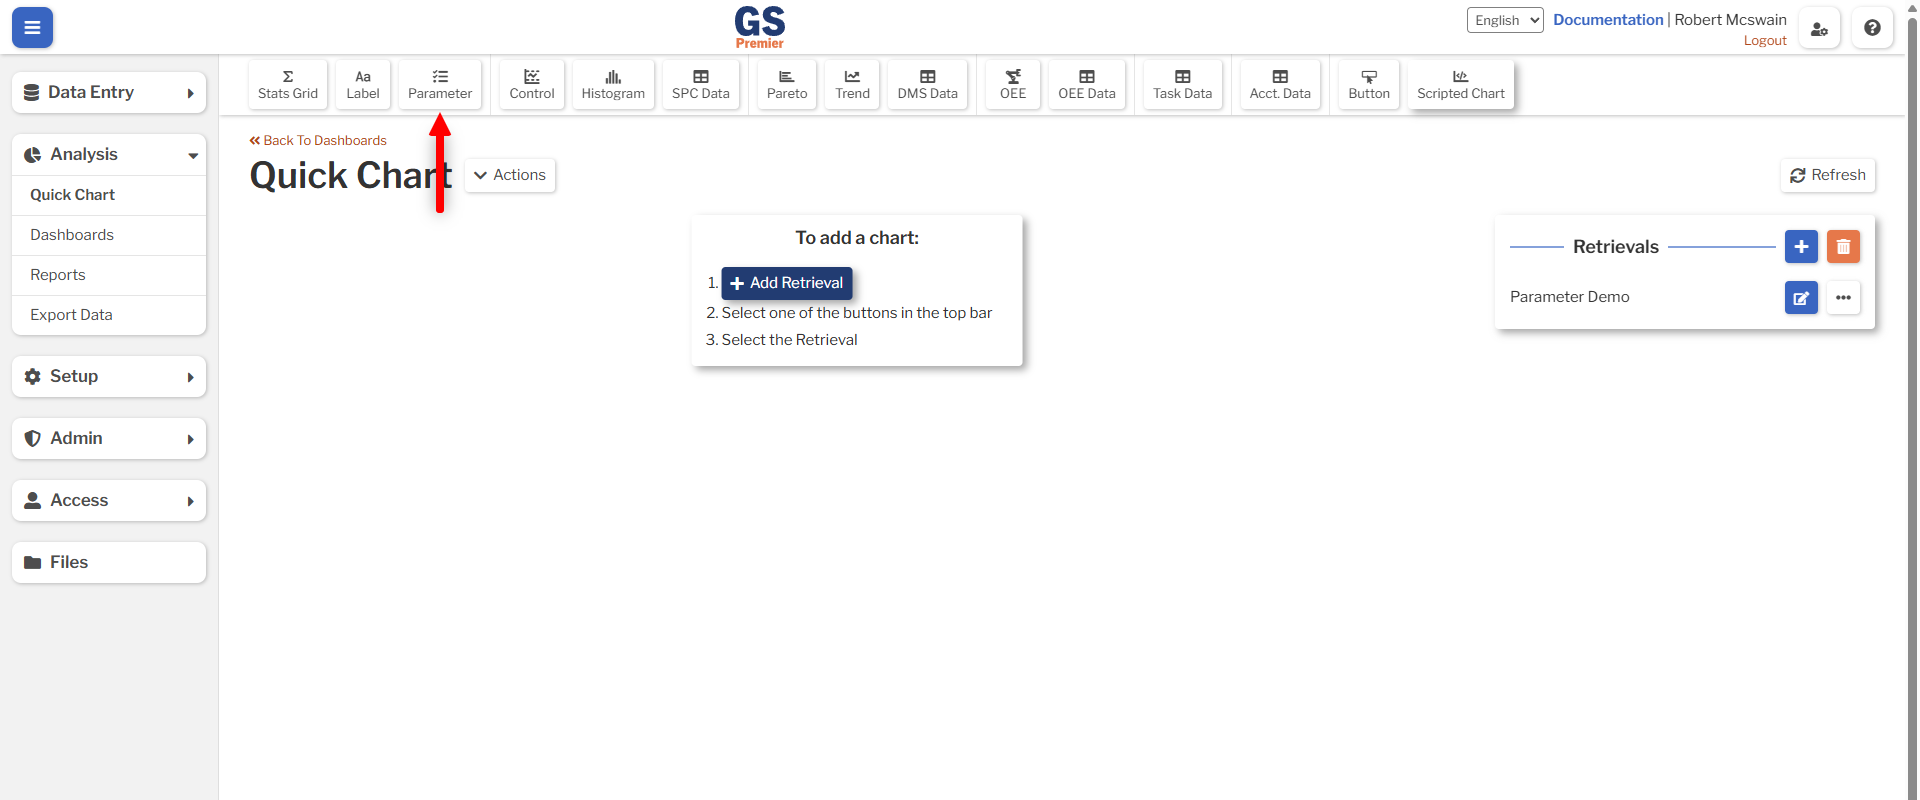
- Change the Label to Material and the Type to Traceability.
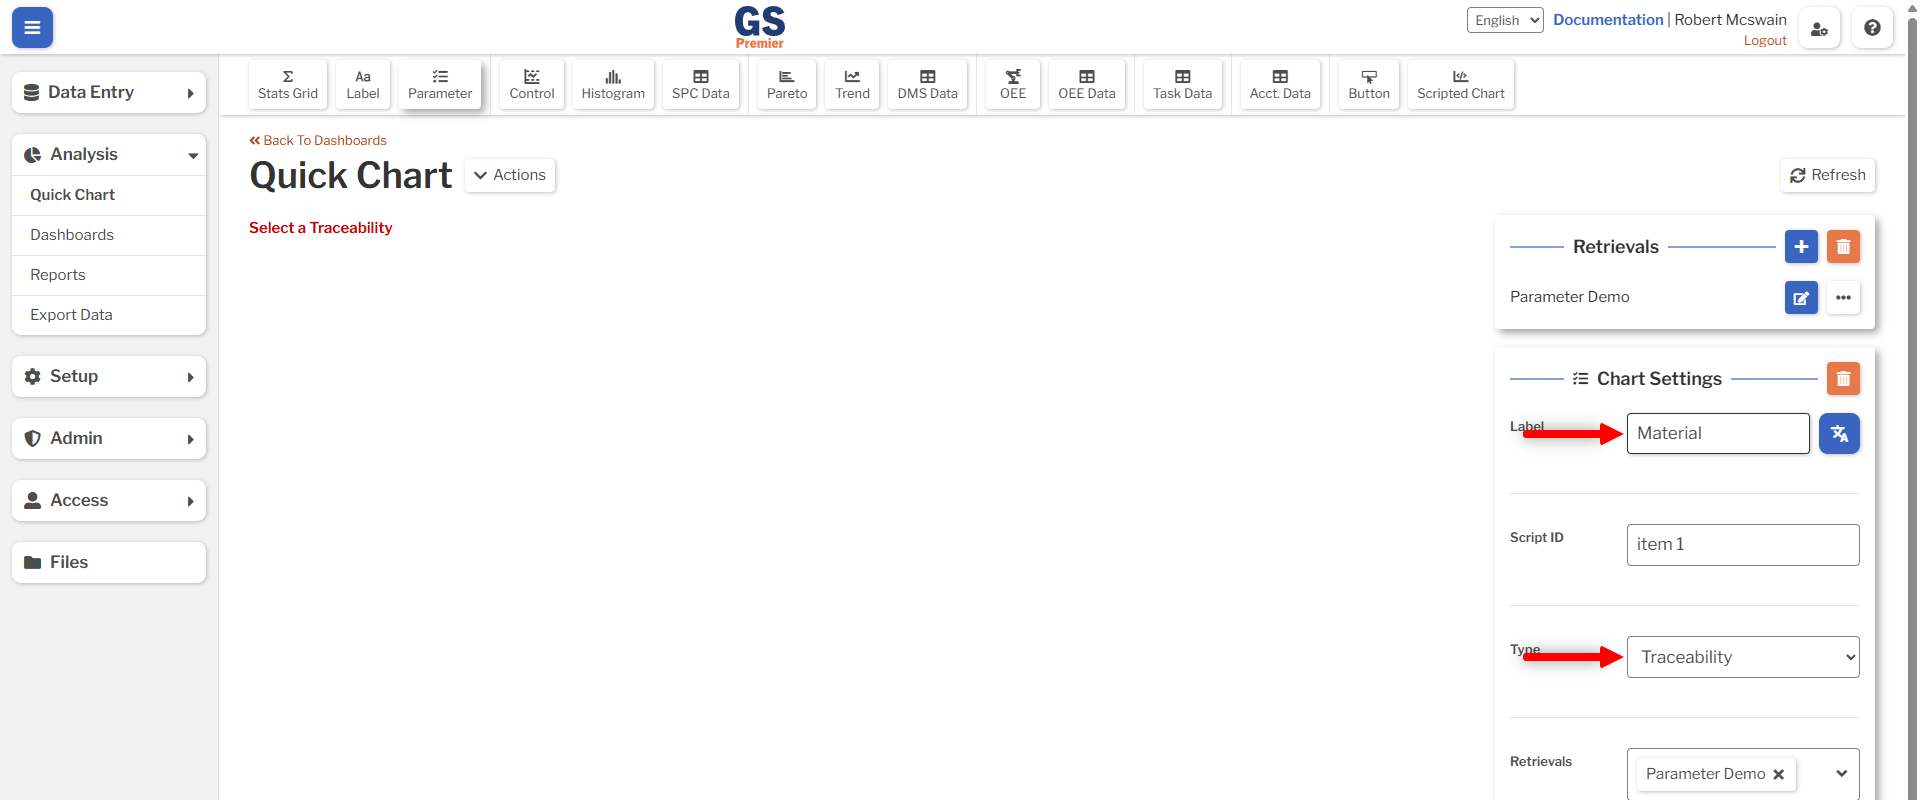
- Press the Traceability button in the property window, then select the Material Traceability in the overlay.
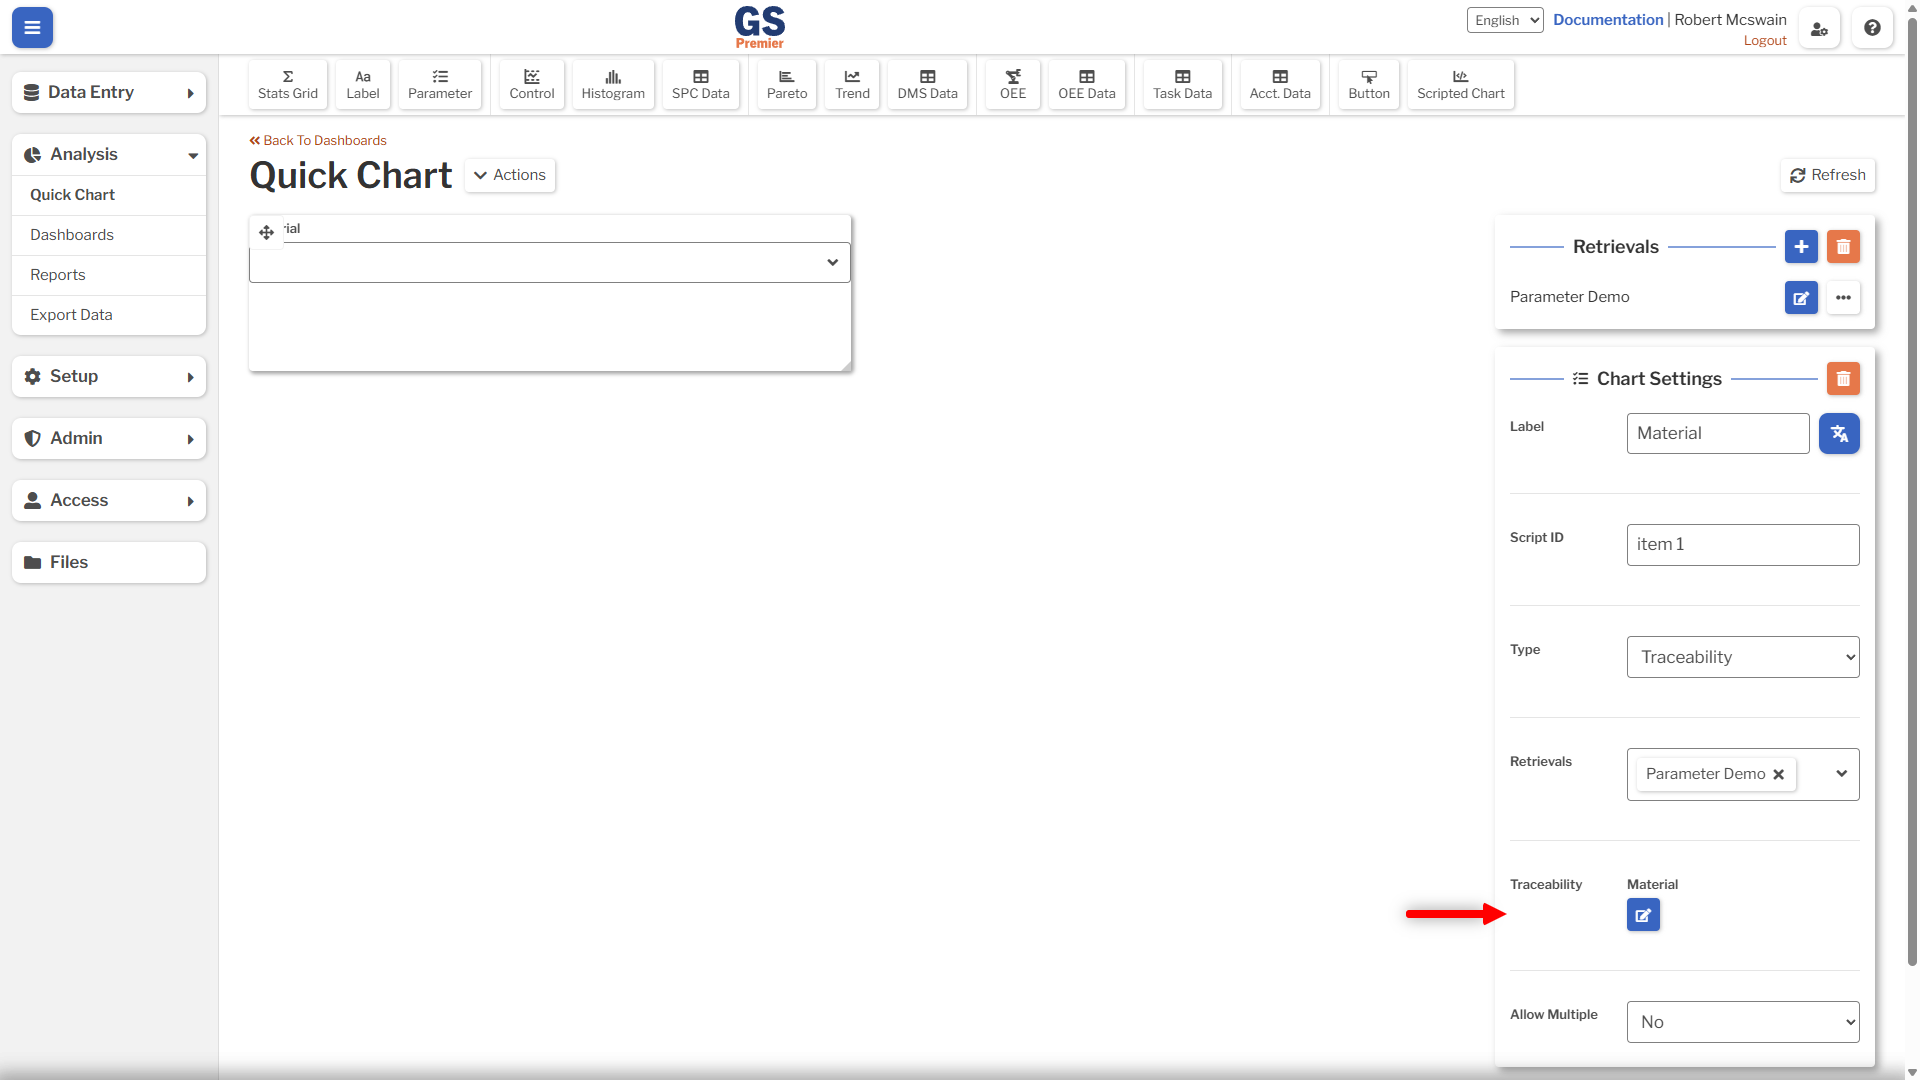
- Resize the Parameter to take up less vertical height.
Add a Date Parameter:
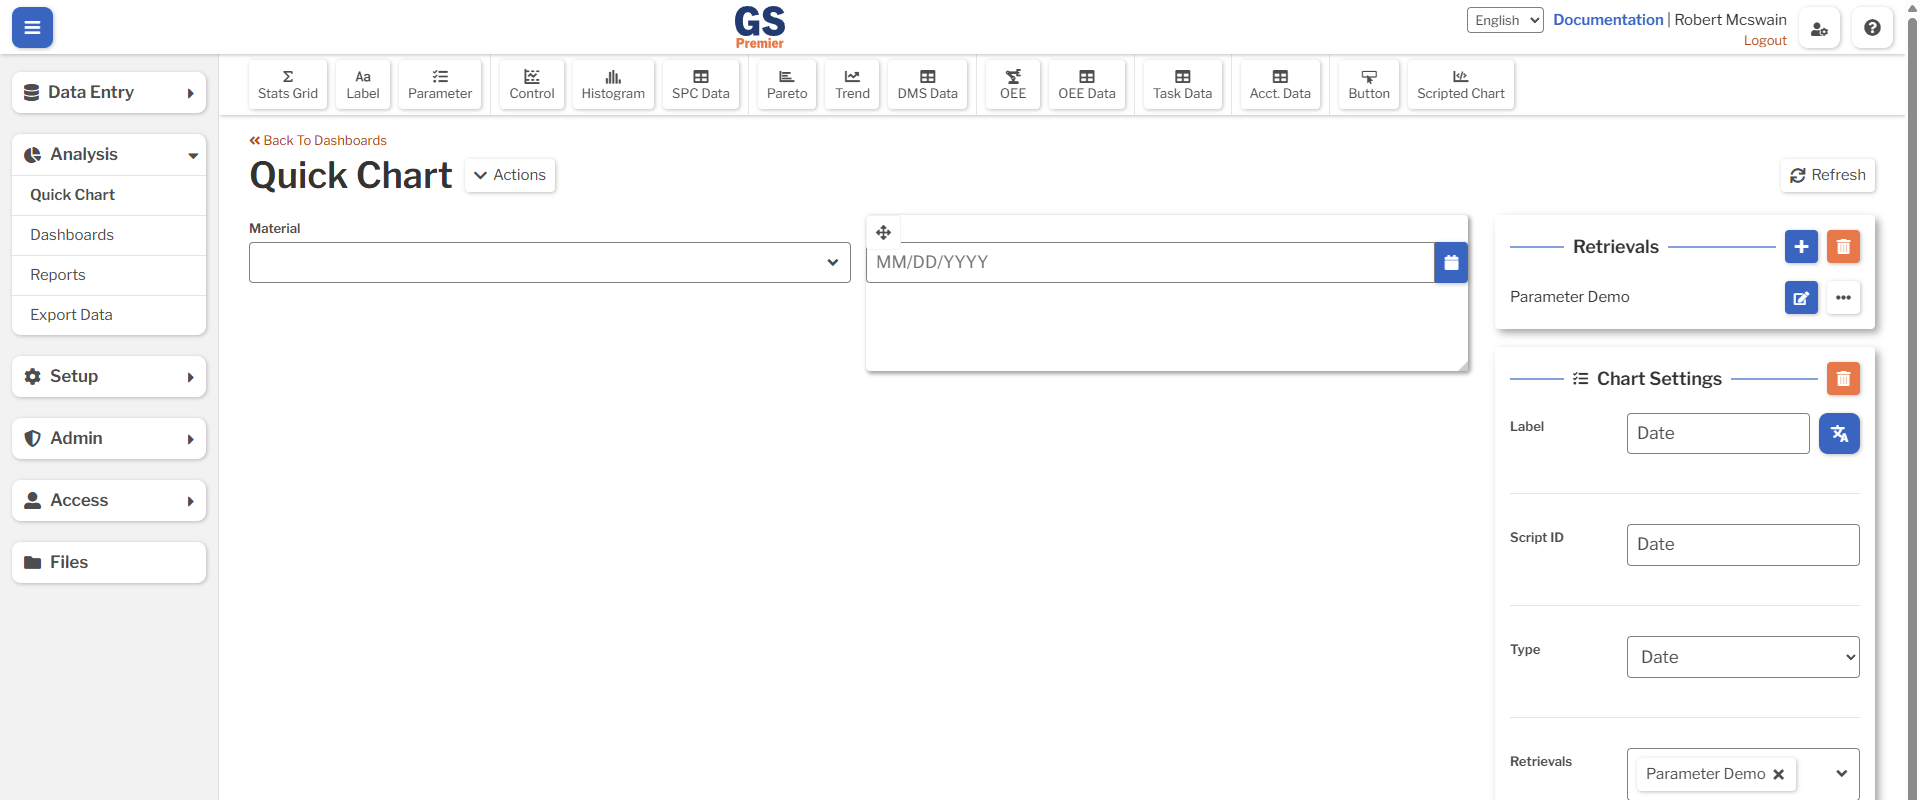
- Select the Parameter button.
- Change the Type to Date.
- Resize the Parameter to take up less vertical height.
Tip
Parameters are automatically linked to all Retrievals that exist when the Parameter is created. If you add more Retrievals later, those Retrievals must be linked to the Parameters manually.
Add Charts
Add a Control Chart and a Pareto Chart to the Dashboard. Select the previously-created Retrieval (Parameter Demo) for both.
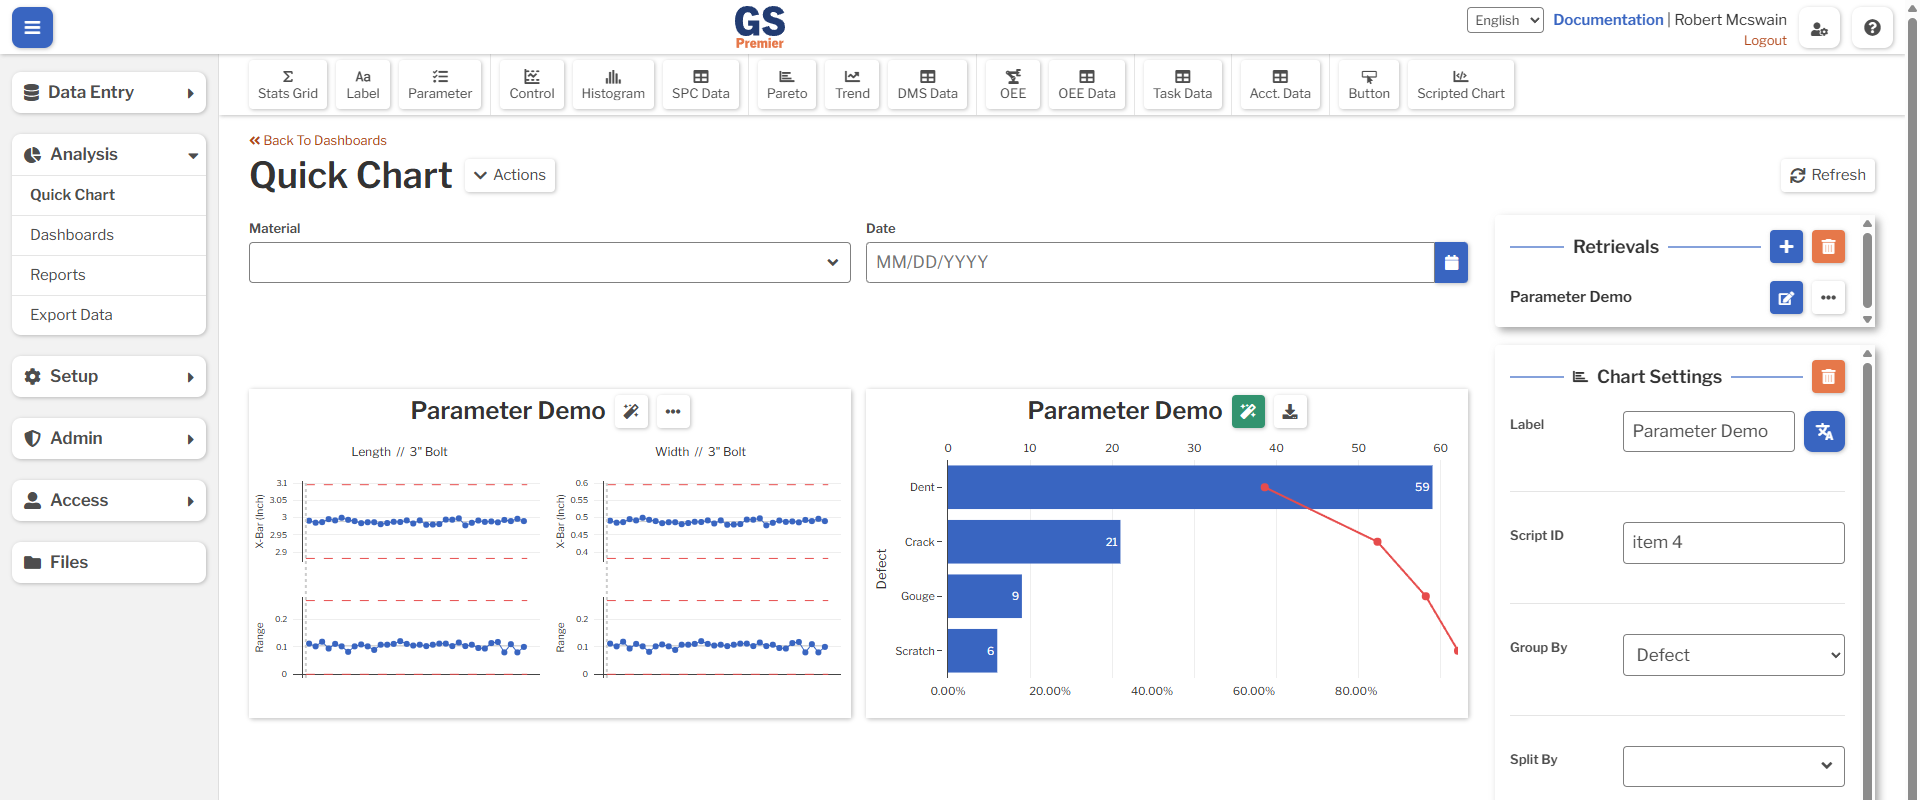
Filter the Dashboard Dynamically
Now test the Parameters by changing their values.
First, select different values in the Material Parameter. Notice that the charts automatically refresh and only display data matching the selected Material.
Next, select a value in the Date Parameter. The charts will refresh again and only display data entered on the selected date.
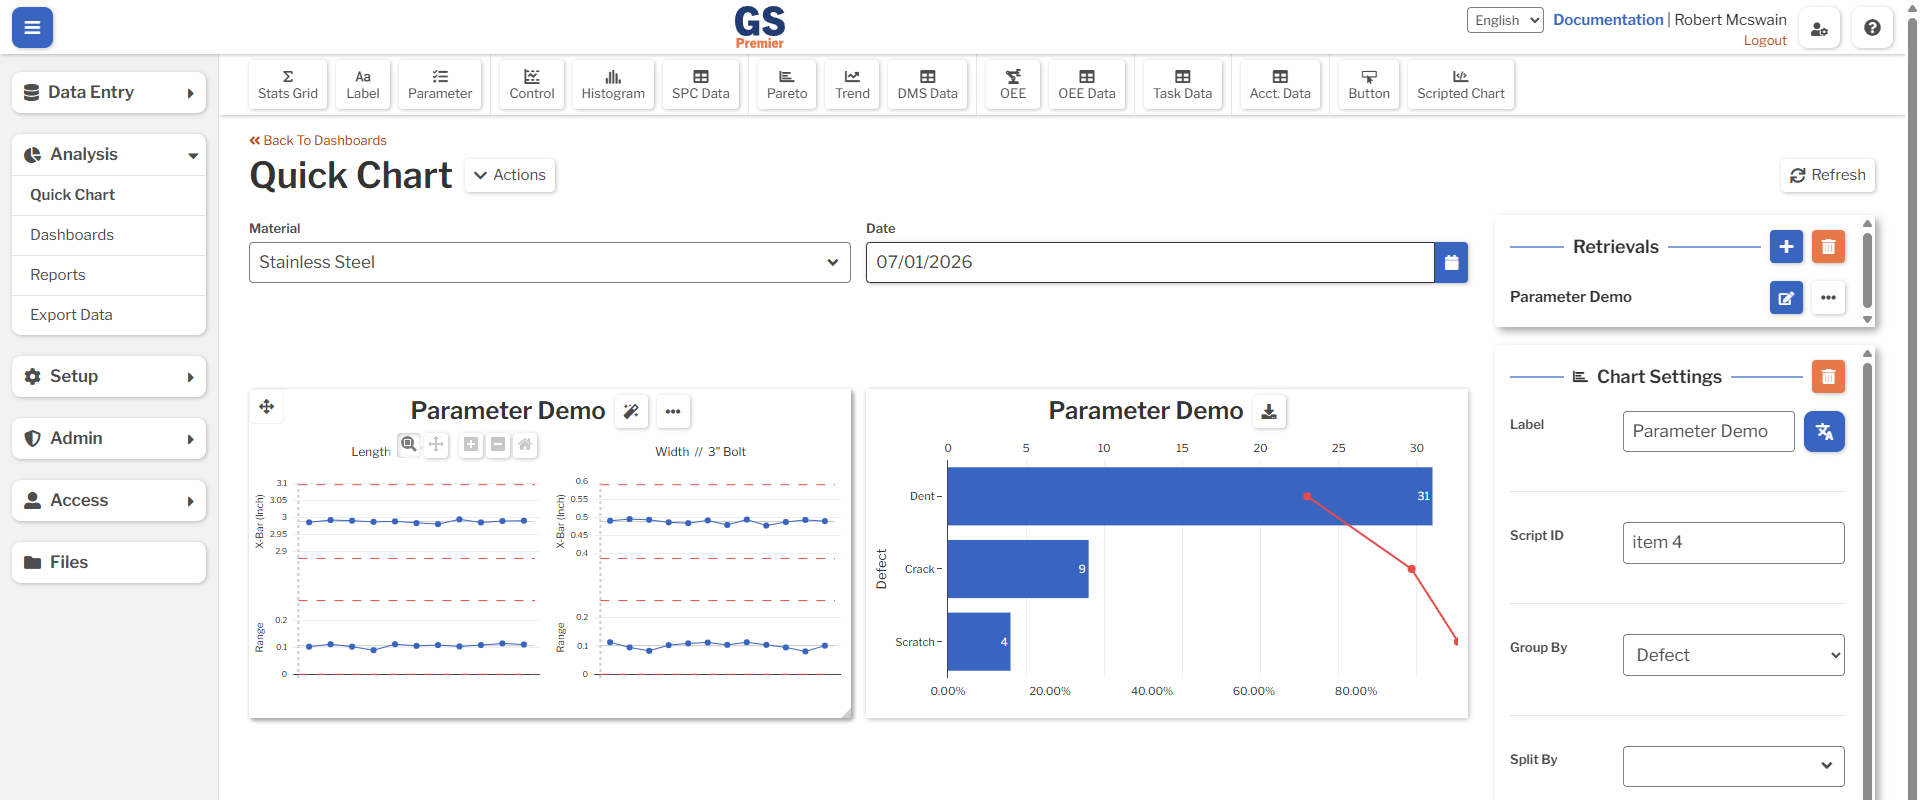
To remove a filter, clear the Parameter's value.
Exercise
Parameters behave the same while editing and viewing a Dashboard. Save and view the Dashboard, then experiment with changing Parameter values.